The Problem
This analysis focuses on understanding how customer value and retention differ across the customer base.
Customer value is not evenly distributed: a small group of buyers often drives most of the revenue. At the same time, not all high-value customers behave the same.
To account for this, customers are first grouped by purchasing behavior (retail vs. bulk), and then analyzed separately to capture more meaningful patterns in value and retention.
From Raw Transactions to Customer Behavior
The analysis is based on the Online Retail dataset, a one-year transaction log from a UK-based e-commerce.
After cleaning and filtering, the data is used to analyze customer behavior, value, and retention patterns over time.
Not All Customers Shop the Same Way
Before running any RFM model, customers are classified by purchasing behavior. A composite "bulk score" flags customers who regularly order in large quantities and at high invoice values, consistent with wholesale or commercial purchasing rather than retail browsing.
The threshold is set at the 85th percentile of avg quantity per invoice, avg invoice value, and max quantity per invoice. Customers above the threshold on at least two of these dimensions are labeled Bulk / commercial-like; the rest are Retail-like.

The scatter plot shows two clean clusters. Bulk buyers sit at the upper-right: systematically higher quantities and higher invoice values. The separation justifies the classification before any RFM scoring is applied.
| Buyer Type | Customers | Customer Share | Total Revenue | Revenue Share | Avg Order Value | Avg Recency |
|---|---|---|---|---|---|---|
| Bulk / commercial-like | 597 | 13.8% | £4,638,014 | 52.2% | £1,282 | 69 days |
| Retail-like | 3,741 | 86.2% | £4,249,195 | 47.8% | £280 | 96 days |
13.8% of customers generate 52% of total revenue, with an average order value 4.6× higher than retail. Bulk buyers also return more often and more recently on average, they are structurally more valuable, not just occasionally larger spenders.
Revenue Is Extremely Concentrated
Even within the full customer base, value concentration is striking. The top 1% of customers by revenue account for nearly a third of all sales.
Generate 32% of total revenue. That's roughly 43 customers responsible for nearly one-third of sales.
Capture 50.5% of revenue, a clear super-majority driven by a small commercial segment.
Account for 61.5% of revenue, while the remaining 90% generate less than 40 cents on the dollar.
Reach 74.7%, close to the classic 80/20 Pareto rule, confirming the structural pattern.
Eight Segments, Two Worlds
RFM scoring assigns each customer a 1–5 score on Recency, Frequency, and Monetary value based on their position within the global customer base. The combined score maps to eight named segments.

| Segment | Customers | Customer Share | Revenue Share | Avg Recency | Avg Frequency |
|---|---|---|---|---|---|
| Best customers | 957 | 22.1% | 65.2% | 13 days | 11.1 invoices |
| Big spenders | 344 | 7.9% | 10.3% | 98 days | 2.2 invoices |
| Loyal high value | 235 | 5.4% | 8.1% | 50 days | 6.4 invoices |
| Mid-value customers | 1,119 | 25.8% | 5.9% | 94 days | 1.8 invoices |
| At risk high value | 168 | 3.9% | 4.2% | 126 days | 5.5 invoices |
| Loyal customers | 375 | 8.6% | 2.7% | 64 days | 3.9 invoices |
| Low value / inactive | 821 | 18.9% | 2.1% | 228 days | 1.0 invoices |
| Recent customers | 319 | 7.4% | 1.6% | 19 days | 1.2 invoices |
The Best customers segment (22% of the base) generates 65% of revenue and has an average recency of just 13 days, they're active, frequent, and high-value. The contrast with Mid-value (26% of customers, 6% of revenue) illustrates why flat engagement strategies miss the point entirely.
Bulk Customers Show Stronger Repeat-Purchase Retention
Monthly cohort retention tracks the share of customers from each acquisition month who return to purchase in later months. Comparing retail and bulk/commercial-like buyers reveals a clear structural difference in purchasing behavior.
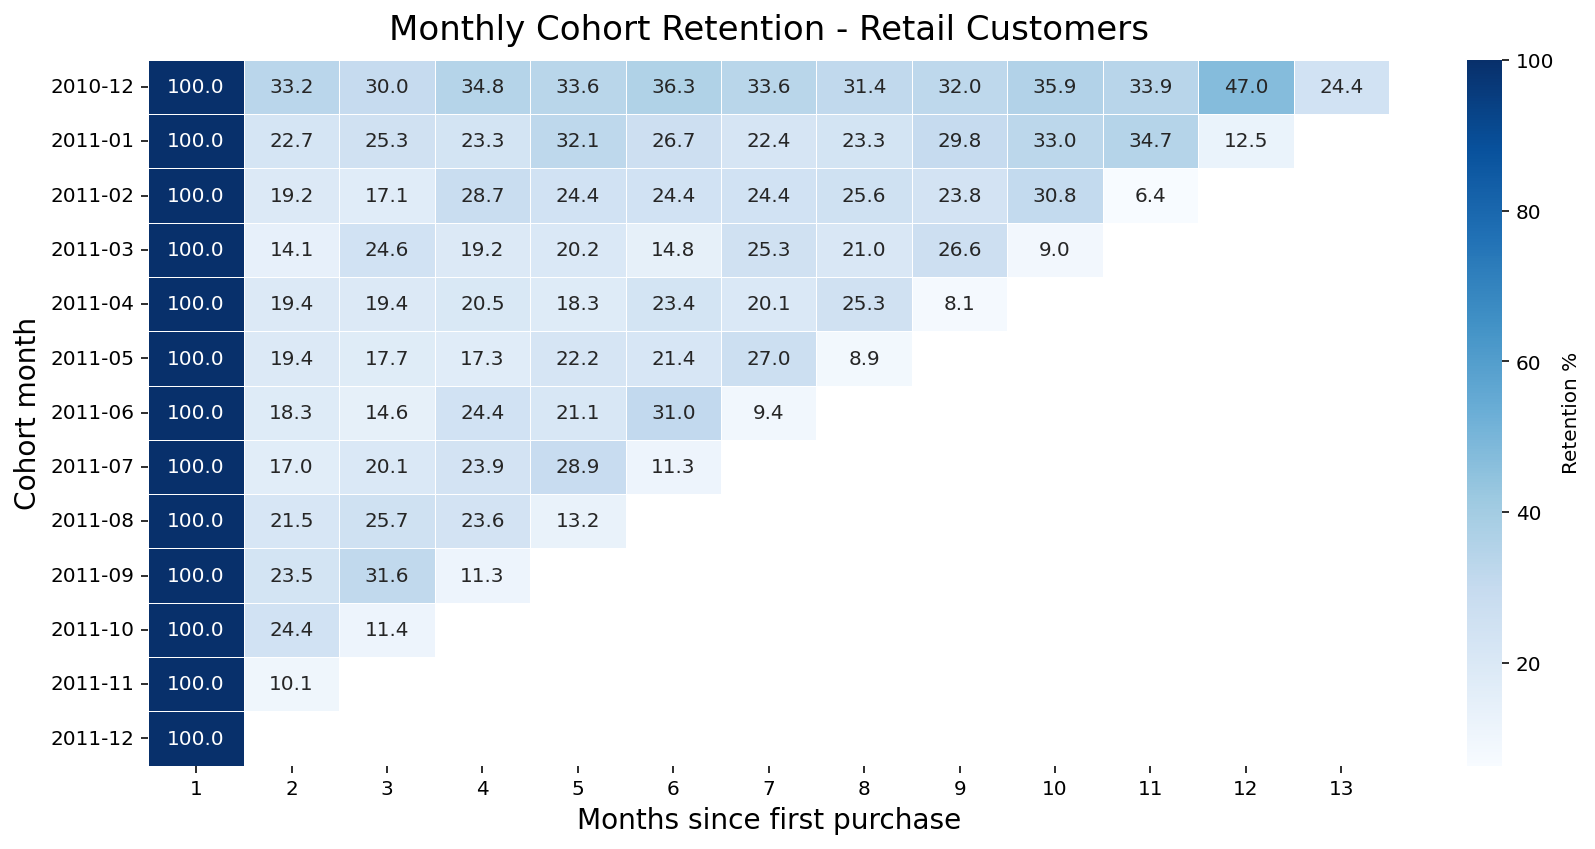
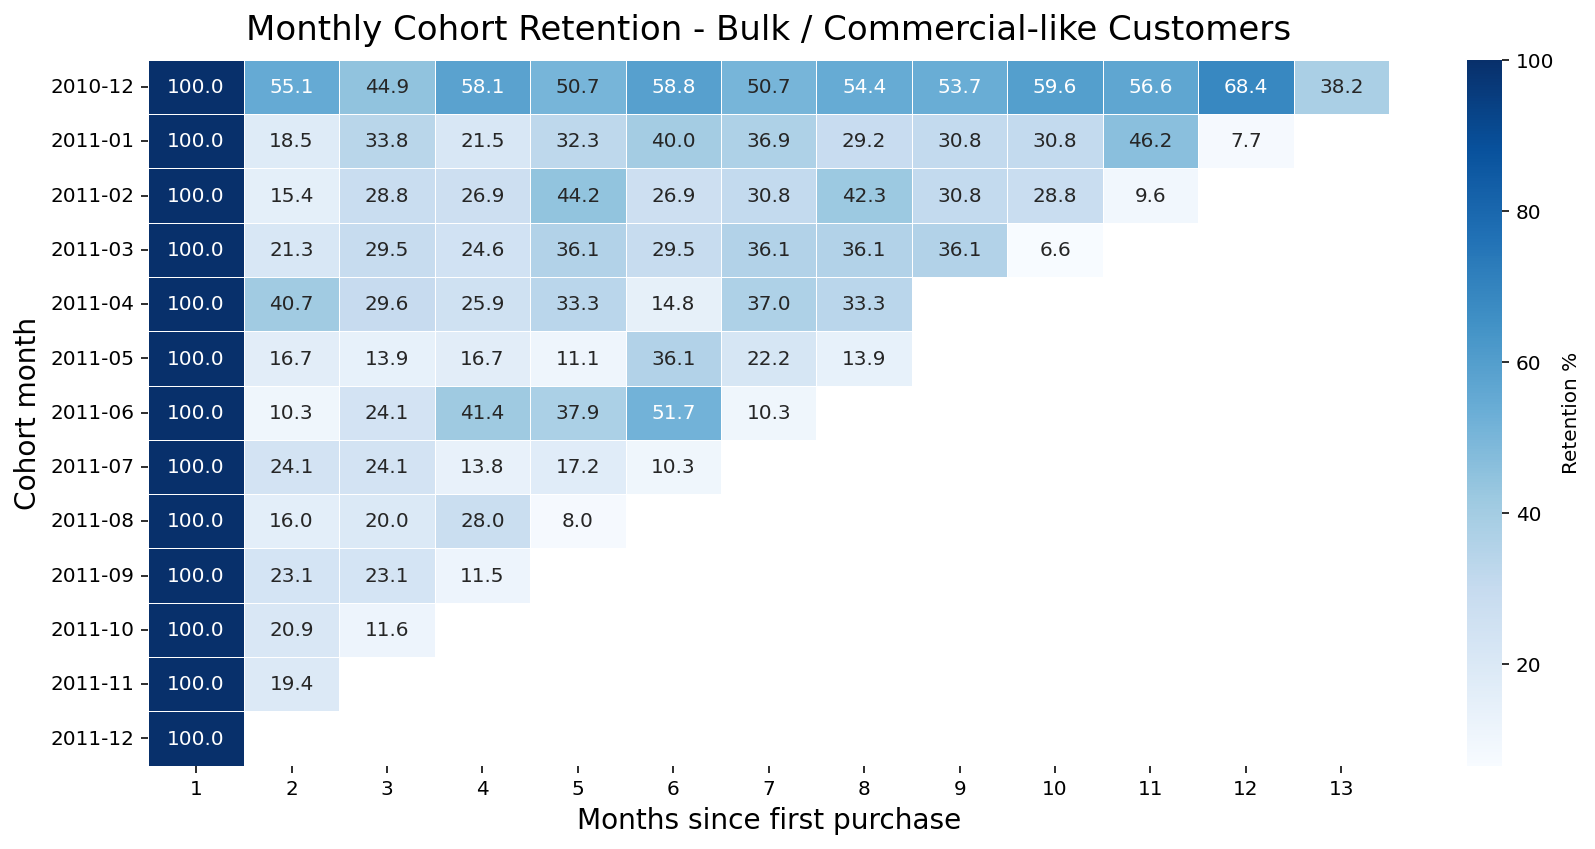
The difference is visible across the most mature cohorts. In the December 2010 cohort, retail customers retain at 33.2% in month 2, while bulk customers retain at 55.1%. More importantly, bulk cohorts continue to hold much higher retention across later months, often staying in the 45–60% range where retail customers more often remain closer to 20–35%.
This suggests that bulk/commercial-like buyers are not simply higher spenders, but customers with a more recurring pueratirchasing pattern, likely driven by oponal replenishment rather than occasional shopping.
Who Stays, Who Slips, Who Recovers
To understand segment stability over time, the bulk customer dataset is split into early and late periods. RFM scoring is applied independently to each period, and the resulting segments are cross-tabulated to produce a transition matrix.

Three patterns stand out. First, Best customers are remarkably sticky: 68.9% remain Best customers in the late period. Second, Loyal high value customers have strong upward mobility: 62.5% graduate to Best customers, suggesting this segment is a pipeline, not a ceiling. Third, Recent customers mostly slide to Mid-value (53.9%), with none graduating to Best, they need nurturing before they stabilize at higher value.
68.9% stay Best customers period over period. Once a commercial account is active and engaged, it tends to stay that way.
62.5% of Loyal high value upgrade to Best. This is the most valuable migration path, and a signal that frequency, not just spend, drives the upgrade.
36.4% of At risk customers become Recent customers, they haven't churned yet, but they've stopped buying.
53.9% of Recent customers move to Mid-value, not upward. New bulk buyers need active engagement early to develop into high-frequency accounts.
Four Actionable Priorities
Protect the Best customers bulk segment above all else
206 customers generating an average of £16,462 each and purchasing every 43 days. A 10% churn rate here costs more than losing the entire Low value / inactive segment. Account management, priority fulfillment, and proactive outreach belong here.
Invest in Loyal high value → Best customer conversion
62.5% of Loyal high value bulk customers upgrade on their own. A structured push: volume incentives, product recommendations, or dedicated account support, could accelerate this pipeline and increase its size.
Act on At risk high value before the window closes
These are high-revenue customers going quiet. With an average recency of 126 days and strong historical spend, they're worth targeted re-engagement. The transition matrix shows 36% are already sliding to Recent, the time to act is now.
Build onboarding for new bulk accounts
Recent bulk customers mostly drift to Mid-value rather than climbing. An early engagement sequence, product education, reorder prompts calibrated to the 10–50 day purchase cycle, could meaningfully shift this trajectory.
Tools Used
The full pipeline is written in Python with Pandas and NumPy for data preparation, transformation, and feature engineering. Visualizations were produced with Matplotlib and Seaborn.