for test variant
for test variant
for test variant
Which campaign actually performs better?
The analysis is designed to go beyond clicks and evaluate whether the test variant improves downstream purchase behavior enough to justify the extra media investment.
60 daily rows across control and test
The dataset covers August 1 to August 30, 2019, with spend, impressions, reach, clicks, searches, content views, add to cart, and purchases for both variants.
The variants win different parts of the funnel
The test campaign drives much stronger traffic efficiency, while the control campaign retains meaningfully stronger commercial intent deeper in the journey.
Why a single headline metric would be incomplete here
A campaign can look successful by improving clicks or impressions while weakening downstream conversion.
This project treats the experiment as a multi-stage funnel, evaluating how each variant impacts the full path from reach to purchase, not just isolated metrics.
That makes the final recommendation more aligned with real business impact.
| Project component | What was done |
|---|---|
| Data preparation | Column standardization, date parsing, derived rate metrics, cost metrics, and missing-value handling |
| Classical inference | Welch t-tests, Mann-Whitney tests, paired day-level tests, sign tests, and FDR correction |
| Uncertainty estimation | Bootstrap confidence intervals and permutation tests |
| Probability view | Bayesian posterior probability of one variant beating the other on key rates |
| Diagnostics | Outlier detection, weekday effects, cumulative curves, and correlation-shift analysis |
The test variant wins attention, but the control variant wins shopping intent
The key result is not a lift in final purchases, but a structural difference.
The test variant is much more effective at generating traffic from impressions, while the control variant is stronger at converting that traffic into carts. As a result, gains at the top of the funnel are offset by losses downstream, leaving final purchases effectively unchanged.
Across multiple statistical checks, this pattern is consistent: early-stage metrics show strong improvements, while purchase-level impact is not significant.
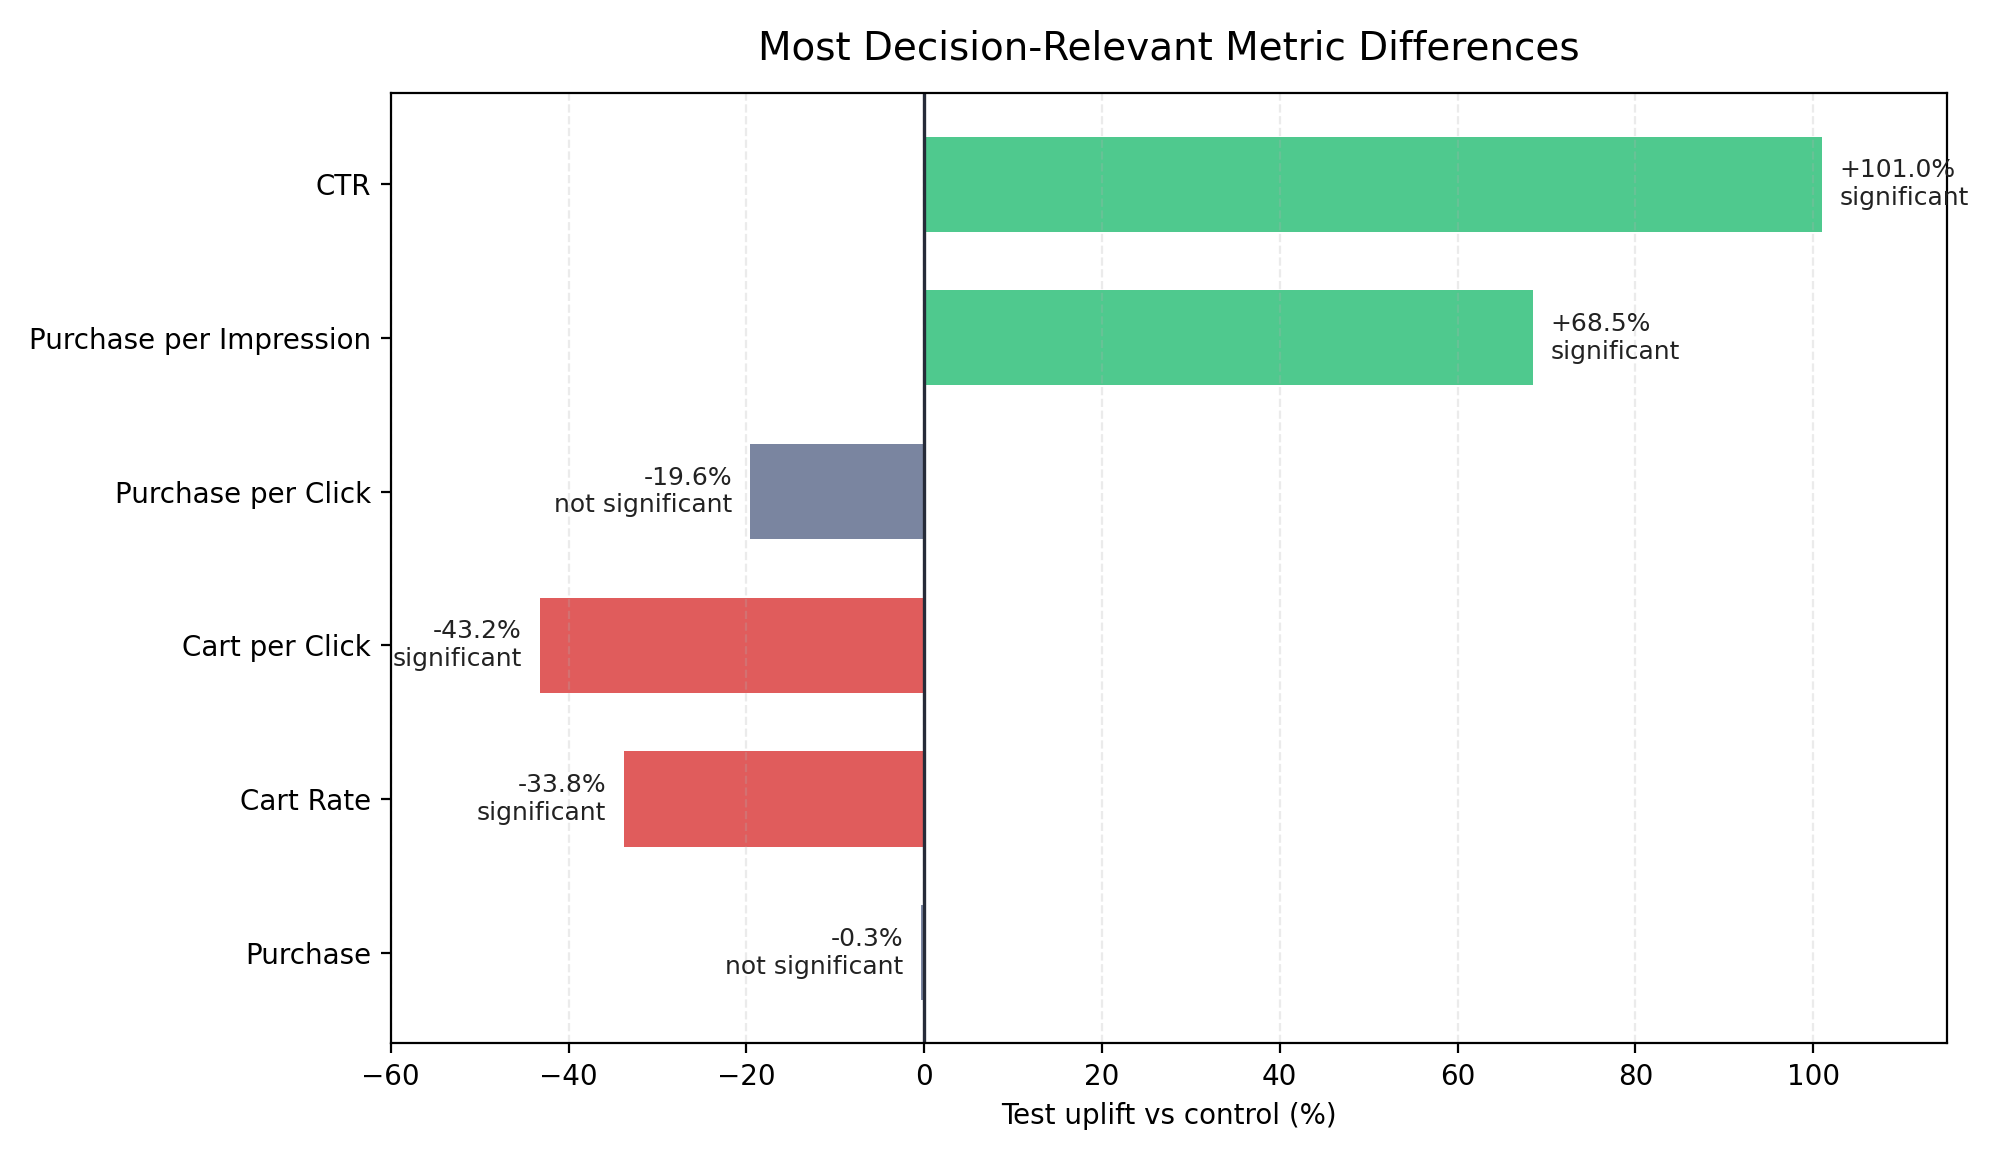
Test strongly increases traffic, roughly doubling CTR and improving purchase per impression.
Control converts better, indicating stronger purchase intent or higher-quality traffic.
Higher traffic comes at a higher cost, increasing CPM and requiring stronger downstream efficiency to justify it.
No clear end-to-end winner, focusing only on clicks would lead to a misleading conclusion.
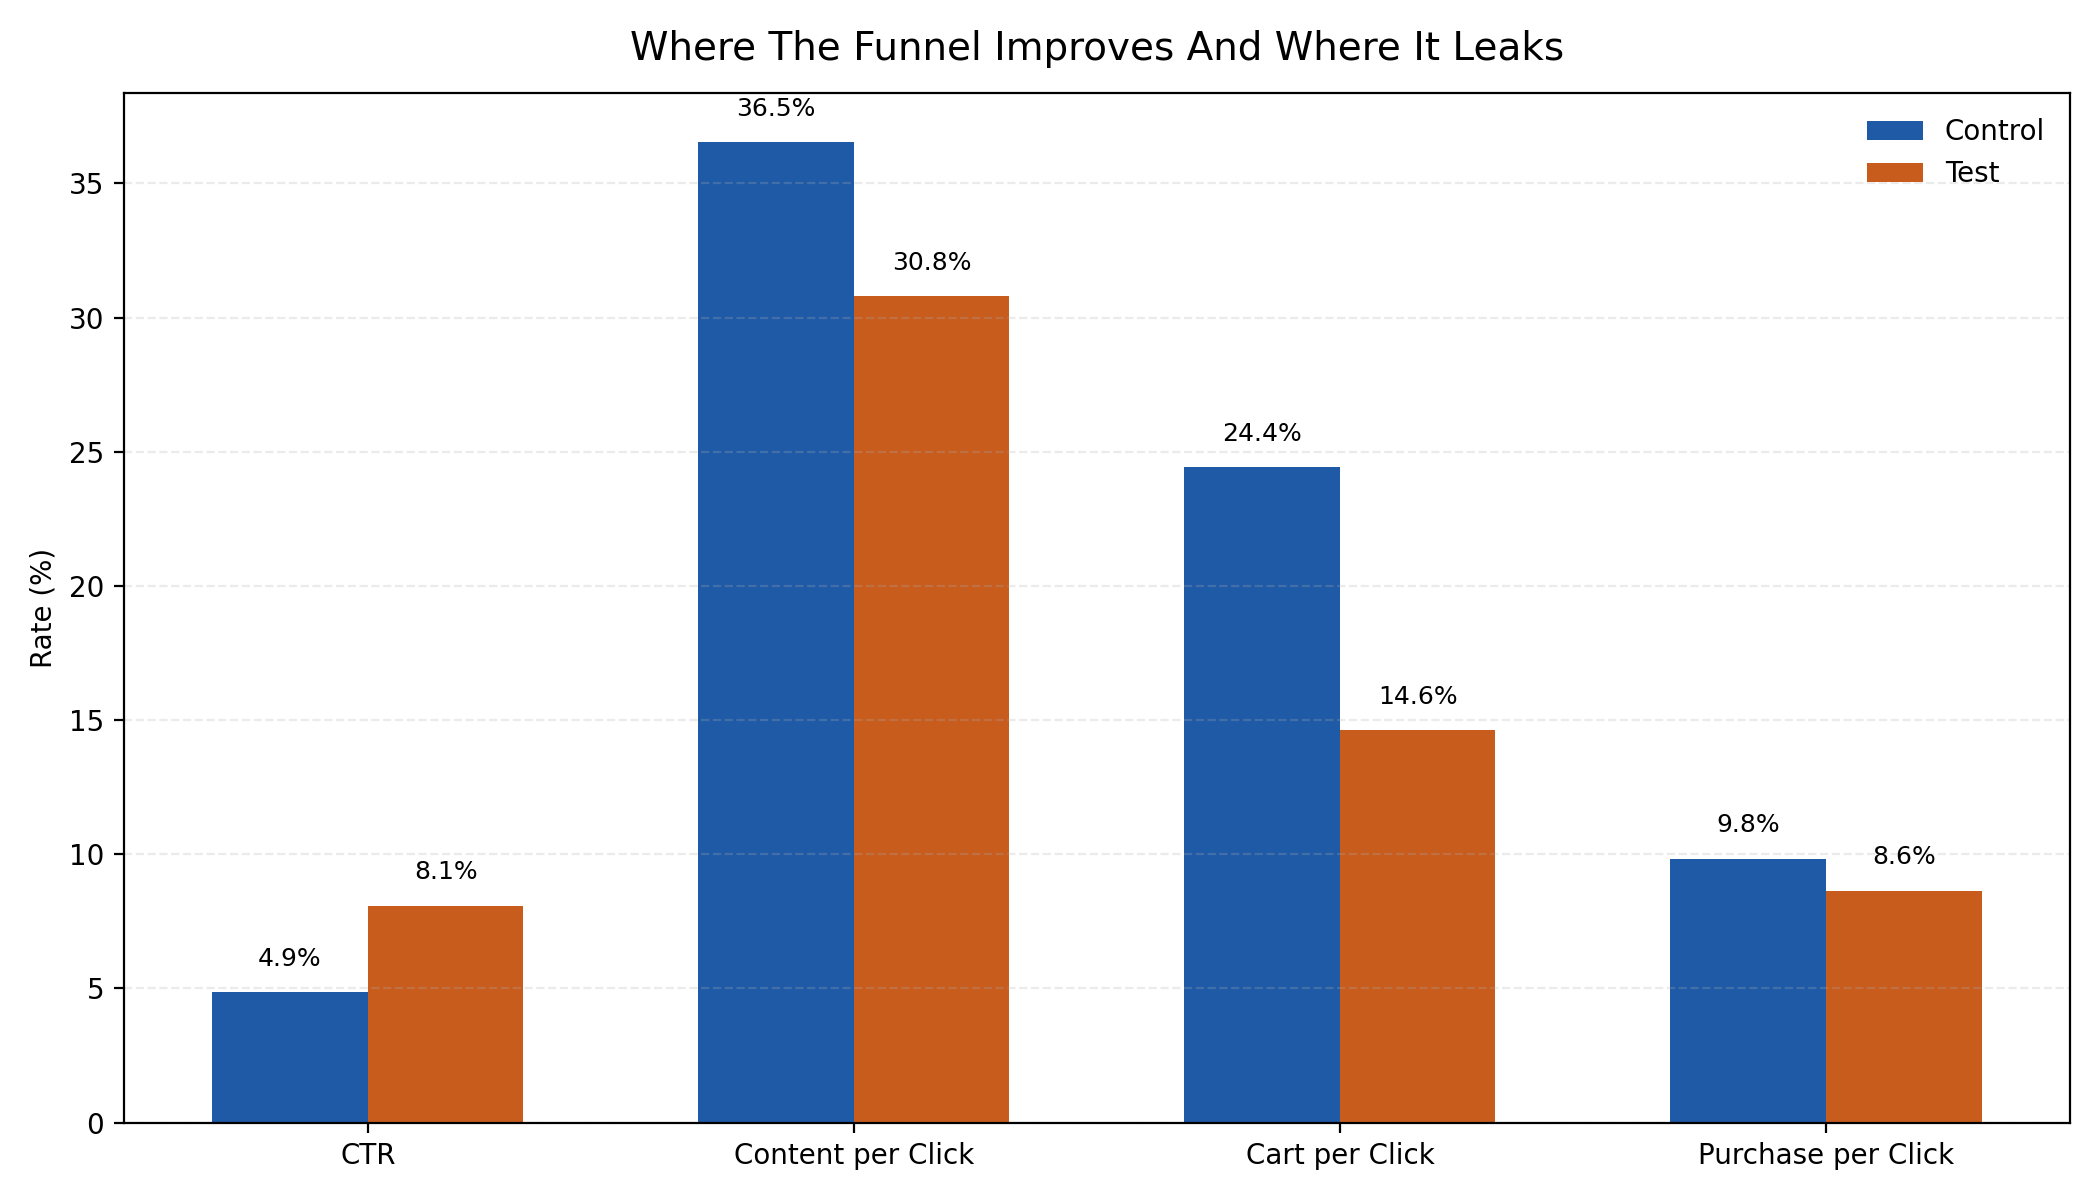
Upper-funnel gains do not translate into a clear purchase lead
The funnel view makes the trade-off clearer.
The test significantly improves traffic generation, but the control remains stronger deeper in the funnel, especially in cart formation and purchase efficiency.
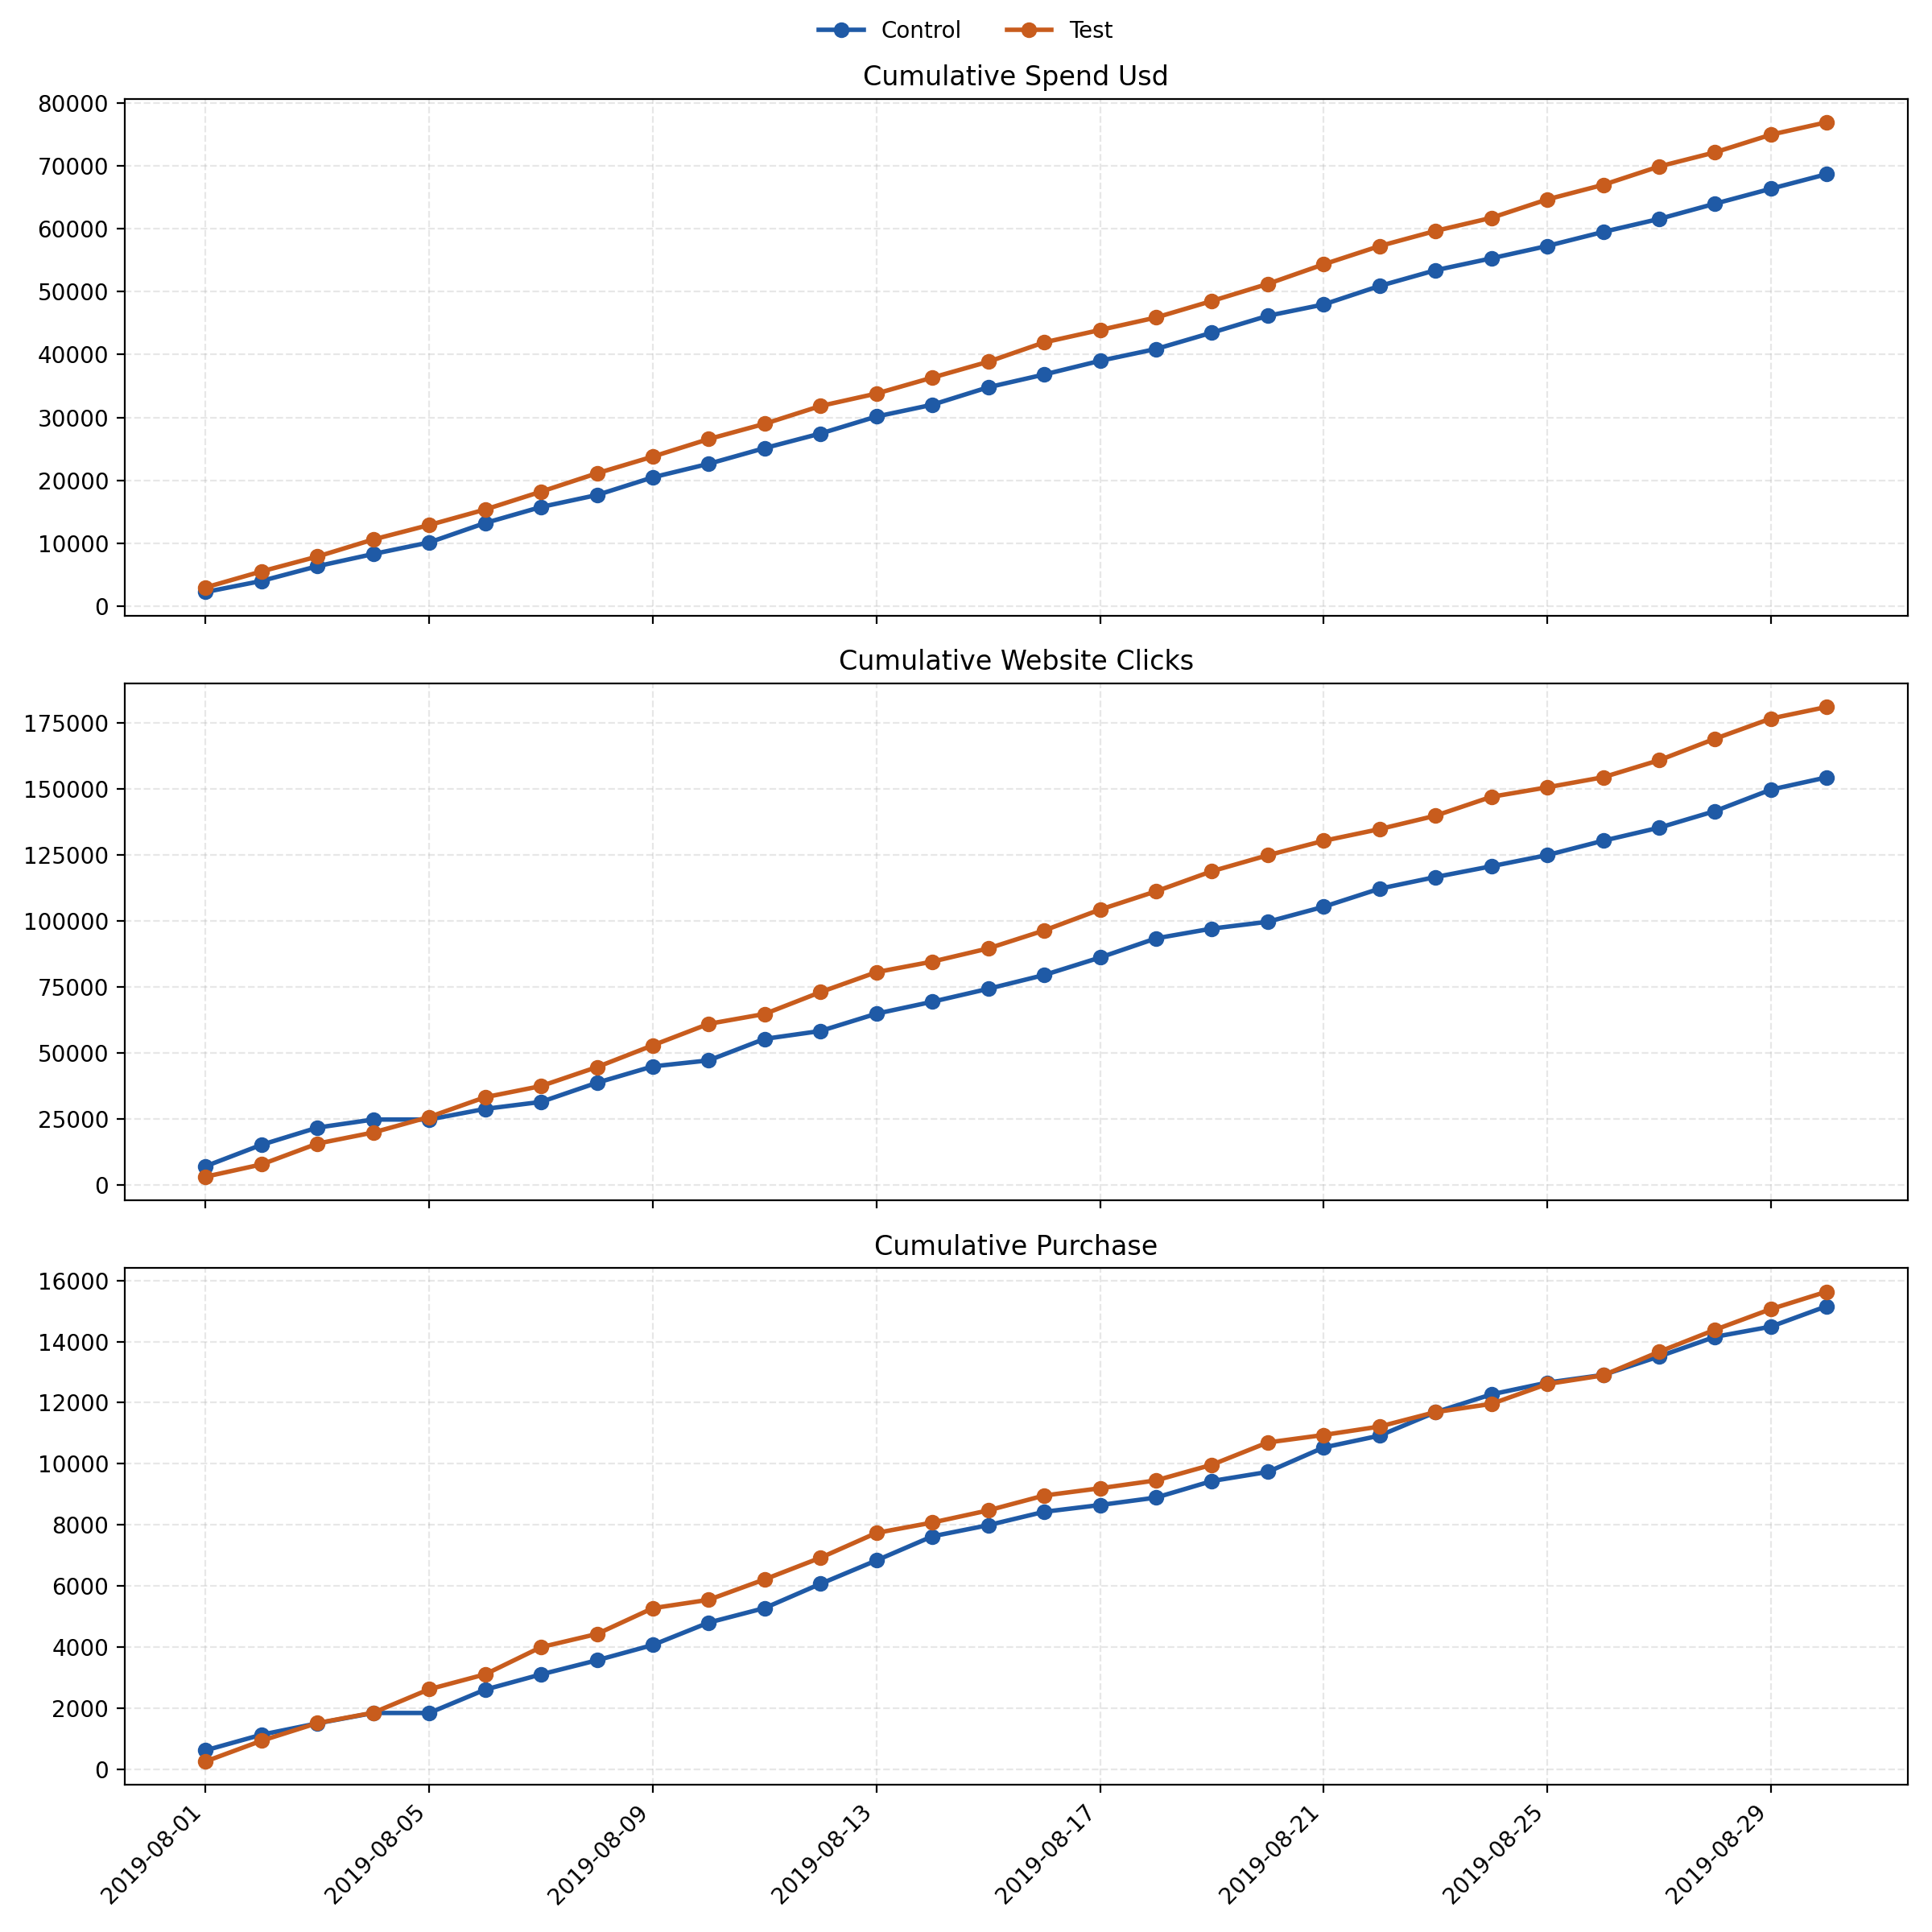
The cumulative view adds a time dimension.
The test steadily builds a click advantage, but purchases remain closely aligned throughout the period, reinforcing the absence of a clear end-to-end winner.
Consistent Signal Across Methods
Multiple analytical approaches were used to validate the results.
Across methods, the conclusion is consistent: the test improves attention and traffic efficiency, but does not improve purchase quality per visit.
| Metric | Test mean | Control mean | Adjusted p-value | Interpretation |
|---|---|---|---|---|
| CTR | 10.24% | 5.10% | 0.0012 | Statistically supported lift in top-of-funnel engagement |
| Cart per click | 15.79% | 27.82% | 0.0013 | Control converts visits into shopping intent much better |
| Purchase per impression | 0.84% | 0.50% | 0.0052 | Test extracts more purchases from each impression |
| Purchase per click | 8.64% | 9.83% | 0.1977 | Directional control advantage, but not significant after correction |
| Purchase | 521.23 | 522.79 | 0.9760 | No evidence of a meaningful final-purchase difference |
The test expands reach efficiently, while the control attracts users with stronger purchase intent.
If the objective is traffic, the test performs better.
If the objective is downstream conversion quality, the control is the safer choice.
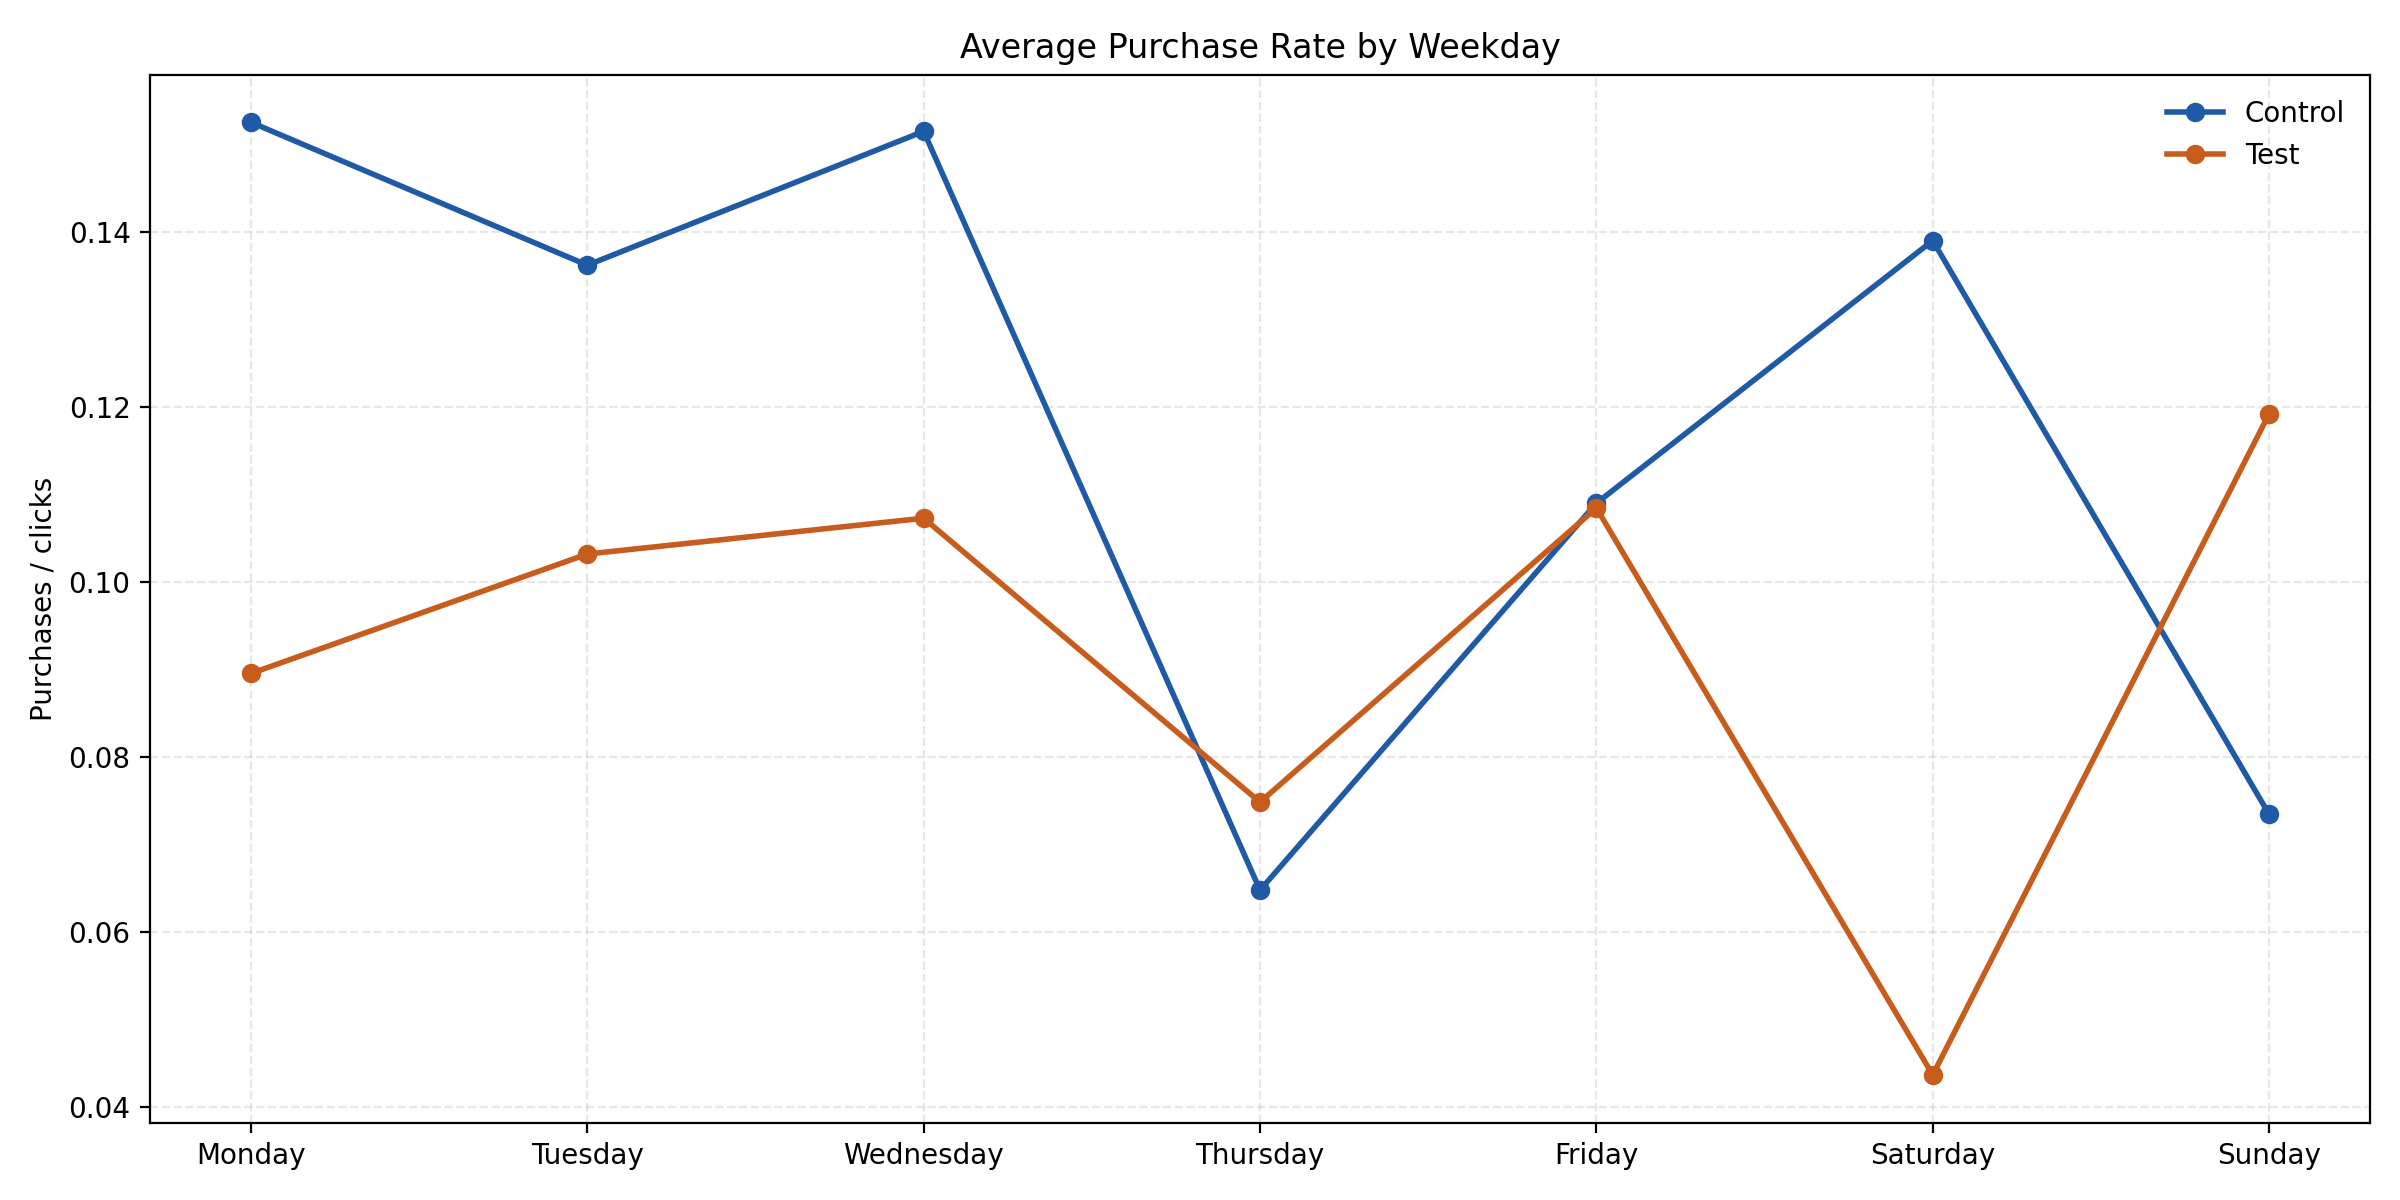
Additional Diagnostics
These diagnostic views help explore patterns beyond the main results.
For example, purchase rates vary by weekday, but none of these differences remain statistically significant after correction. This suggests directional variation, but not a reliable driver of the overall outcome.
Recommended interpretation for the business
The test should not be declared a universal winner
The extra traffic is real, but the test should not replace the control outright if the business optimizes for efficient purchase behavior rather than raw engagement.
The top-of-funnel strength is worth preserving
The click-generation advantage is meaningful. The next iteration should retain that strength while improving what happens after the click.
A follow-up test should target the landing-page and cart step
The evidence points to a handoff problem between ad engagement and commercial intent. That is the most promising place for the next experiment.
Future experiment reviews should stay multi-metric
This project demonstrates why decision-making should combine funnel metrics, cost metrics, and uncertainty measures instead of treating one KPI as the whole story.
Tools Used
The project was built in Python using Pandas and NumPy for data preparation and metric engineering, SciPy for inferential testing, and Matplotlib for the visual layer. The final analysis combines classical significance testing with resampling methods and Bayesian probability estimates to produce a decision-ready A/B testing workflow.